PCSSD Report Card 2013-2014
P. 1
Achievement
3rd Grade Literacy
Combined Population TAGG
African American Hispanic
Caucasian
Economically Disadvantaged Students with Disabilities Limited English Proficient Female
Male
3rd Grade Mathematics Combined Population TAGG
African American
Hispanic
Caucasian
Economically Disadvantaged Students with Disabilities Limited English Proficient Female
Male
4rd Grade Literacy Combined Population TAGG
African American
Hispanic
Economically Disadvantaged Students with Disabilities Limited English Proficient Female
Male
4rd Grade Mathematics Combined Population TAGG
African American
Hispanic
Caucasian
Economically Disadvantaged Students with Disabilities Limited English Proficient Female
Male
5th Grade Literacy Combined Population TAGG
African American
Hispanic
Caucasian
Economically Disadvantaged Students with Disabilities Limited English Proficient Female
Male
5th Grade Mathematics Combined Population TAGG
African American
Hispanic
Caucasian
Economically Disadvantaged Students with Disabilities Limited English Proficient Female
Male
5th Grade Science Combined Population TAGG
African American
Hispanic
Caucasian
Economically Disadvantaged Students with Disabilities Limited English Proficient Female
Male
6th Grade Literacy Combined Population TAGG
African American
Hispanic
Caucasian
Economically Disadvantaged Students with Disabilities Limited English Proficient Female
Male
6th Grade Mathematics CombinedPopulation TAGG
African American
Hispanic
Below
%Tested Basic Basic Proficient Advanced Advanced AMO
97.4 2.70 96.6 6.19 98.3 9.24 94.8 40.0 100 6.25 98.8 3.73 95.7 10.7
97.2 26.3 97.7 34.8 97.7 33.8 97.4 16.0 96.6 19.4 98.3 32.5 94.8 78.6 100 30.3 98.8 22.7 95.7 29.8
97.2 45.7 97.7 57.4 97.7 61.1 97.4 45.3 96.6 29.1 98.3 56.5 94.8 81.4 100 63.6 98.8 43.4 95.7 48.0
97.6 8.46 98.2 12.9 97.5 11.6 98.4 8.06 97.4 5.11 98.1 11.6 99.3 48.9 100 13.0 97.5 2.60 97.6 13.4
28.4 16.9 31.8 45.5 46.9 19.4 32.6
20.6 23.5 23.4 29.3 16.5 24.0 9.66 45.5 19.5 21.7
36.7 33.4 30.3 42.7 42.5 34.4 14.5 36.4 38.8 34.6
21.0 26.9 26.0 12.9 16.9 27.1 34.1 13.0 14.5 26.7
Prof & %Tested Basic Basic Proficient Advanced Advanced
Characteristics
Below %Tested Basic Basic
Prof & Proficient Advanced Advanced AMO
Characteristics
Other Demographics
Limited English proficiency 2% Lowincome 36% Student eligible to receive special education10%
1.1%
Two or More Races
59 7 68 33 13 5
38.98 57.14 60.29 36.36 46.15 60
59 84.75 7 71.43 63 92.06 32 81.25 12 66.67 5 100
School District State 79 50 55 74 45 55 80 52 58 83 50 58 68 46 50 76 49 54 72 49 52 76 57 61 64 47 47 76 51 54 69 55 60
Y 28 876 N 3 36 N 01 N 3 81 N 0 4 N 1 67 N 01 A
278
N 31 790 Y 4 254 N0 27
Achievement
3rd Grade Literacy
Combined Population TAGG
African American Hispanic
Caucasian
Economically Disadvantaged Students with Disabilities Limited English Proficient Female
Male
3rd Grade Mathematics Combined Population TAGG
African American
Hispanic
Caucasian
Economically Disadvantaged Students with Disabilities Limited English Proficient Female
Male
4th Grade Literacy Combined Population TAGG
African American
Hispanic
Caucasian
Economically Disadvantaged Students with Disabilities Limited English Proficient Female
Male
4th Grade Mathematics Combined Population TAGG
African American
Hispanic
Caucasian
Economically Disadvantaged Students with Disabilities Limited English Proficient Female
Male
5th Grade Literacy Combined Population TAGG
African American
Hispanic
Caucasian
Economically Disadvantaged Students with Disabilities Limited English Proficient 5th Grade Mathematics Combined Population TAGG
African American
Hispanic
Caucasian
Economically Disadvantaged Limited English Proficient 5th Grade Science Combined Population
Academic Growth
Combined Population TAGG
African American
Prof &
Achievement
3rd Grade Literacy
Below
%Tested Basic Basic Proficient Advanced Advanced
99.5 11.0 14.2 99.7 15.2 18.1 99.6 14.2 18.2 100 17.1 19.7 99.4 8.20 10.5 99.8 14.9 17.1 98.9 34.9 27.4 100 23.3 18.6 99.7 8.91 10.5 99.2 13.1 17.9
99.5 3.88 18.2 99.7 5.37 24.0 99.6 6.45 26.5 100 2.63 25.0 99.4 2.09 10.9 99.8 5.00 24.5 98.9 13.1 33.7 100 2.33 32.6 99.7 3.44 18.0 99.2 4.32 18.4
99.0 3.70 13.6 99.0 5.52 18.4 99.1 4.60 18.8
27.4 47.4 74.8 76.47 31.3 35.5 66.8 69.32 30.2 37.4 67.6 69.27 30.3 32.9 63.2 77.34 25.2 56.1 81.3 82.71 31.5 36.5 68 70.50 22.9 14.9 37.8 44.21 34.9 23.3 58.2 68.00 26.9 53.8 80.78
27.9 41.0 68.9
33.9 44.1 78 77.13 36.8 33.8 70.6 70.73 36.8 30.2 67 68.22 34.2 38.2 72.4 79.18 31.5 55.5 87 85.20 36.5 34.0 70.5 71.56 28.6 24.6 53.2 50.89 37.2 27.9 65.1 71.85 34.1 44.5 78.6
33.6 43.7 77.3
35.9 46.8 82.7 76.47 41.3 34.7 76 69.32 41.4 35.2 76.6 69.27
25 7 13 2 19 5 30 8 19 3
8 2 15 2
34 5 16 0 28 2 40 7 26 2 16 2 24 3
27 3 12 1 20 1 33 4 19 1
6 1 12 0
32 15 24 38 22 10 17
39 16 30 47 28 18 27
30 13 21 37 20
7 12
28 9 20 34 17 6 12
GraduationRate Combined
GraduationRateforTargeted AchievementGapGroup
Graduation Rate African American
Graduation Rate Hispanic
Graduation Rate Caucasian
GraduationRateEconomically Disadvantaged
GraduationRateStudents with Disabilities
GraduationRateLimited English Proficient
Grade Inflation Rate
College Remediation Rate
Enrollment
October 1 Enrollment
School Environment
Discipline Policies Distibuted to Parents
Discipline Training Provided to Staff
Parental Involvement Plan Adopted
District Alternative Learning Environment Compliance
Expulsions
Weapons Incidents
Staff Assaults
Student Assaults
Retention
Number of Students Retained at Grade 1
Percent of Students Retained at Grade 1
Number of Students Retained at Grade 2
Percent of Students Retained at Grade 2
Number of Students Retained at Grade 3
Percent of Students Retained at Grade 3
Number of Students Retained at Grade 4
PercentofStudents RetainedatGrade4
Number of Students Retained at Grade 5
Percent of Students Retained at Grade 5
Number of Students Retained at Grade 6
Percentof StudentsRetainedatGrade6
Number of Students Retained at Grade 7
Percent of Students Retained at Grade 7
Number of Students Retained at Grade 8
Percent of Students Retained at Grade 8
Teacher Quality
%Teachers Completely Certified (Licensed)
%Teachers with Emergency/Provisional Credentials
%Teachers with Bachelor's Degree
%Teachers with Master's Degree
%Teachers with Advanced Degree
HQ Teachers in High Poverty Schools %CoreAcademicClassesnotTaughtbyHQTeachers
HQ Teachers in Low Poverty Schools
%Core Academic Classes not Taught by HQTeachers
HQ Teachers Aggregate of All Economic Levels
%Core Academic Classes not Taught by HQTeachers
School Choice
Percent of Students School Choice
School Funding
Mills Voted
Expenditure Per Student
Average Teacher Salary
Total Expenditures
Instructional Expenditures
Administrative Expenditures
Extracurricular Expenditures
Capital Expenditures
Debt Service Expenditures
Free and Reduced Meals
Percent of Students Eligible for Free and Reduced Meals
State Free and Reduced-Price Meal Rate***
NationalFreeandReduced-PriceMeal Rate**
School Board Members Hours of Training
Zone 1
Zone 2
Zone 3
Zone 4
Zone 5
Zone 6
Zone 7
**Source: FNS National databank for federal fiscal year 2014. ***State Free and Reduced Meal Rateincludespreschoolandadulteducationstudents.*AMOAnnualMeasurableObjective
BAKER INTERDISTRICT ELEMENTARY SCHOOL CONT'D
ARNOLD DRIVE ELEMENTARY SCHOOL
4150 Arnold Drive, Jacksonville, AR 72076 • 501-988-4145
Demographics
ARNOLD DRIVE ELEMENTARY SCHOOL CONT'D
BAKER INTERDISTRICT ELEMENTARY SCHOOL 15001 Kanis Road, Little Rock, AR 72223 • 501-228-3250
Demographics
463 Race/EthnicityStatistics
Enrollment
Avg. Class Size
Avg. years teaching Experience 8 Perpupilspending
• District avg. $11,115
•Stateavg. $9,457 SchoolChoiceTransfers 0 46.5% White
10 40 9 100 Enrollment
3.0%
Two or More Races
Academic Growth
Combined Population 5810 TAGG 3727 African American 2612 Hispanic 381 Caucasian 2653 Economically Disadvantaged 3521 Students with Disabilities 695 Limited English Proficient 185 Achievement Below
46.71 5621 36.57 3602 34.34 2543 45.93 352 57.37 25.78 36.89 3415 17.84 673 35.68 164
100 1.94 18.423 30.8 56.5 87.3 82.71
99.4 4.65 18.2 97.1 22.4 35.9 100 1.75 36.8 99.1 1.24 9.78 98.9 6.12 17.4
99.0 11.3 18.3 99.0 16.1 23.6 99.1 17.2 23.4 100 10.7 22.3 98.7 7.17 14.5 99.4 14.6 24.4 97.1 42.9 21.8 100 17.5 26.3 99.1 9.63 18.2 98.9 13.0 18.3
99.1 2.57 13.0 99.0 3.98 18.1 99.4 2.83 18.5 100 3.49 16.3 98.6 2.36 7.97 99.7 3.58 17.3 95.9 17.9 42.0 100 0.00 27.3 99.5 1.39 9.06 98.7 3.65 16.6
99.1 16.5 19.6 99.0 23.5 24.1 99.4 23.6 25.3 100 20.9 24.4 98.6 10.1 14.1 99.7 22.7 24.5 95.9 56.2 16.0 100 28.9 24.4 99.5 16.2 20.7 98.7 16.8 18.5
99.1 12.6 43.3 99.0 18.1 49.7 99.4 18.9 51.5 100 17.4 50.9 98.6 6.70 36.4 99.7 16.9 51.3 95.9 47.5 33.3 100 17.8 57.8 99.5 10.4 49.0 98.7 14.6 38.0
97.7 9.21 29.8 99.3 13.6 36.4 98.2 11.9 38.4 98.3 11.9 35.6 97.4 6.54 21.0 99.4 12.6 35.4 98.6 49.3 41.1 100 19.4 41.9 98.4 4.60 24.8 97.1 13.7 34.6
97.7 16.6 22.1 99.3 23.2 27.8 98.2 26.0 28.2 98.3 13.6 23.7
41.6 35.6 77.2 70.50 28.8 12.9 41.7 44.21 38.6 22.8 61.4 68.00 34.2 54.8 89
37.6 38.8 76.4
32.4 38.0 70.4 77.13 34.6 25.7 60.3 70.73 35.4 23.9 59.3 68.22 37.9 29.1 67 79.18 29.8 48.5 78.3 85.20 34.8 26.3 61.1 71.56 20.6 14.7 35.3 50.89 38.6 17.5 56.1 71.82 32.6 39.6 72.2
32.3 36.4 68.7
37.3 47.1 844 76.47 42.6 35.3 77.9 69.32 43.2 35.5 78.7 69.27 38.4 41.9 80.3 77.34 33.2 56.5 89.7 82.71 43.5 35.6 79.1 70.50 27.2 13.0 40.2 44.21 36.4 36.4 72.8 68.00 35.4 54.2 89.6
39.0 40.7 79.7
42.0 21.9 63.9 77.13 39.5 12.9 52.4 70.72 40.6 10.6 51.2 68.22 41.9 12.8 54.7 79.18 44.4 31.3 75.7 85.20 40.0 12.8 52.8 71.56 21.0 6.79 27.79 50.89 40.0 6.67 46.67 71.83 42.1 21.0 63.1
42.0 22.7 64.7
36.5 7.63 44.13 29.0 3.21 32.21 26.8 2.83 29.63 26.7 5.81 32.51 46.2 10.7 56.9 28.7 3.03 31.73 17.3 1.85 19.15 20.0 4.44 24.44 34.3 6.26 40.56 38.5 8.87 47.37
40.1 20.9 61 76.47 36.6 13.4 50 69.32 37.4 12.3 49.7 69.27 37.3 15.3 52.6 77.34 43.1 29.4 72.5 82.71 38.0 14.0 52 70.50 8.90 0.68 9.58 44.21 29.0 9.68 38.68 68.00
32 48
22 44
42 42
73 21 5 1
Y
30 524 71 843 59 504
212 2,439
62 1,514 4.88% 4.64% 2.3 572 2.89% 2.63%
98.9% 95.7% 1.6% 0.8% 53.0% 57.0% 44.0% 41.0% 1.0% 1.0%
0.6% 0.9% 4.1% 0.6% 2.3% 0.7% 0.13% 2.82%
State
37.5 $9,457 $48,060 $5,288,037,508 $2,500,807,896 $325,831,774 $174,851,754 $423,083,973 $285,311,300
60.9% 61.2% 52.1%
Below Prof & %Tested Basic Basic Proficient Advanced Advanced AMO Male 100 4.55 18.2 47.7 29.5 77.2
%%
42.1 28.5 38.1 13.7
30.1 31.2 29.0 20.0 29.6 16.1 32.2 30.5
70.6 Hispanic 51.8 Caucasian
94.4 10.6 95.3 7.22 97.9 6.38 95.7 4.45 95.1 8.17 85.6 41.6 100 14.3 97.7 3.56 93.9 8.37
32.7 34.0 27.7 18.5 31.8 41.6 50.0 24.2 29.1
N/A N/A N/A N/A N/A N/A N/A
61.3 77.13 49 70.73 45.7 68.22 62.7 79.18
3.1% Asian
22.1% Black/AfricanAmerican 2.3% Hawaiian/Pacific Islander 17.1% Hispanic/Latino
Economically Disadvantaged StudentswithDisabilities Limited English Proficient Female
Male
0
4
AMO
93.40 81.25 92.10 81.25 96.63 84.09 57.15 83.35
92.05 77.04 86.19 90.63 97.47 77.28 62.50 92.50
93.40 81.25 92.10 81.25 96.63 84.09 57.15 83.34
92.05 77.04 86.19 90.63 97.47 77.28 62.50 92.50
93.40 81.25 92.10 81.25 96.63 84.09 57.15 83.34
92.05 77.04 86.19 90.63 97.47 77.28 62.50 92.50
258 Race/EthnicityStatistics 20 0.4% American Indian
Hispanic
Caucasian
Economically Disadvantaged StudentswithDisabilities Limited English Proficient
GradeOneReadingComprehension GradeOneMathProblems
Grade Two Reading Comprehension Grade Two Math Problems
Grade Three Reading
Grade Three Math
Grade Four Reading GradeFourMath
Grade Five Reading
Grade Five Math
Grade Five Science
Arkansas ESEA Accountability Needs Improvement
26 19 5 4
61.54 42.11 60 25
22 17 4 4
School District 44 50 41 45 62 52 56 50 51 46 61 49 63 49 67 57 57 47 51 51 64 55
Y 28
N 3
N 0
N 3
N 0
N 1 67 N 01
B 262
Y 31
N 4 254
BAKER INTERDISTRICT ELEMENTARY SCHOOL CONT'D
8.5% TwoorMoreRaces
Below
%Tested Basic Basic Proficient Advanced Advanced AMO
33.7% Black/African American $11,115 0.0% Hawaiian/Pacific Islander
$9,457 3.2% Hispanic/Latino 1 40.2% White
Academic Growth
CombinedPopulation TAGG
African American Hispanic
Caucasian
Economically Disadvantaged Students with Disabilities LimitedEnglishProficient
Grade One Reading Comprehension Grade One Math Problems
Grade Two Reading Comprehension Grade Two Math Problems
Grade Three Reading
Grade Three Math
Grade Four Reading
Grade Four Math
Grade Five Reading
Grade Five Math
Grade Five Science
Arkansas ESEA Accountability Needs Improvement
172 59.88 165 90.3 45 44.44 43 81.4
100 7.32 9.76 22.0 100 89.70 17.4 21.7 100 8.33 0.00 33.3
RV RV RV RV 100 5.56 5.56 22.2 100 5.88 11.8 23.5
RV RV RV RV
RV RV RV RV 100 0.00 5.00 25.0 100 14.3 14.3 19.0
100 0.00 9.76 41.5 100 0.00 8.70 47.8 100 0.00 16.7 41.7
61.0 83 95.16 52.2 73.9 90.63 58.3 91.6 91.18
RV RV 100.00 66.7 88.9 95.46 58.8 82.3 88.16
RV RV 90.63
RV RV 100.00 70.0 95
52.4 71.4
48.8 90.3 97.58 43.5 91.3 93.75 41.7 83.4 91.18
Combined Population 100 4.69 3.13 17.2 75.0 TAGG 100 6.25 12.5 37.5 43.8 African American 100 13.0 8.70 21.7 56.5 Hispanic RV RV RV RV RV Caucasian 100 0.00 0.00 20.8 79.2 Economically Disadvantaged 100 8.33 16.7 33.3 41.7 Students with Disabilities RV RV RV RV RV Limited English Proficient RV RV RV RV RV Female 100 2.78 2.78 13.9 80.6 Male 100 7.14 3.57 21.4 67.9 3rd Grade Mathematics
Combined Population 100 1.56 4.69 12.5 81.3 TAGG 100 0.00 18.8 37.5 43.8 African American 100 4.35 13.0 21.7 60.9 Hispanic RV RV RV RV RV Caucasian 100 0.00 0.00 8.33 91.7 Economically Disadvantaged 100 0.00 16.7 50.0 33.3 Students with Disabilities RV RV RV RV RV Limited English Proficient RV RV RV RV RV Female 100 0.00 5.56 13.9 80.6 Male 100 3.57 3.57 10.7 82.1 4th Grade Literacy
Combined Population 100 1.19 1.19 21.4 76.2 TAGG 100 4.55 4.55 36.4 54.5 African American 100 4.55 4.55 27.3 63.6 Hispanic RV RV RV RV RV Caucasian 100 0.00 0.00 21.6 78.4 Economically Disadvantaged 100 0.00 5.56 33.3 61.1 Students with Disabilities RV RV RV RV RV Limited English Proficient RV RV RV RV RV Female 100 0.00 0.00 22.0 78.0 Male 100 2.33 2.33 20.9 74.4 4th Grade Mathematics
Combined Population 100 3.57 11.9 17.9 66.7 TAGG 100 13.6 18.2 36.4 31.8 African American 100 9.09 27.3 22.7 40.9 Hispanic RVRVRVRVRV
RV RVRVRVRV RV 100.00
100 0.00 5.56 38.9 100 0.00 11.8 41.2 RV RV RV RV
790
Needs Improvement Priority NeedsImprovementPriorityMetYear1 ExitCriteria Needs Improvement Focus
Needs Improvement Focus Met Year 1 Exit Criteria Achieving
Exemplary
School Rating
Overall Points for School Rating
Annual Accreditation Status
Annual Accreditation Status Accredited Accredited-Cited
Accredited-Probationary
Attendance Rate (*State Goal 91.13%)
Attendance Rate Combined
Attendance Rate for Targated Achievement Gap Group Attendance Rate African American
Attendance Rate Hispanic
Attendance Rate Caucasian
Attendance Rate Economically Disadvantaged Attendance Rate Students with Disabilities
Attendance Rate Limited English Proficient
Dropout Rate
Enrollment
October 1 Enrollment
School Environment
Discipline Policies Distributed to Parents
Discipline Training Provided to Staff
Parental Involvement Plan Adopted
District Alternative Learning Environment Compliance Expulsions
Weapons Incidents
Staff Assaults
Student Assaults
Retention
Number of Students Retained at Grade 1
Percent of Students Retained at Grade 1
Number of Students Retained at Grade 2
Percent of Students Retained at Grade 2
Number of Students Retained at Grade 3
Percent of Students Retained at Grade 3
Number of Students Retained at Grade 4
Percent of Students Retained at Grade 4
Number of Students Retained at Grade 5
Percent of Students Retained at Grade 5
Teacher Quality
%Teachers Completely Certified (Licensed) %Teachers with Emergency/Provisional Credentials %Teachers with Bachelor's Degree
%Teachers with Master's Degree
%Teachers with Advanced Degree
HQ Teachers in High Poverty Schools
%Core Academic Classes not Taught by HQTeachers HQ Teachers in Low Poverty Schools
%Core Academic Classes not Taught by HQTeachers HQTeachers Aggregate of All Economic Levels %Core Academic Classes not Taught by HQTeachers School Choice
55.6 94.5 100.00 47.1 88.3 92.10 RV RV 81.25 RV RVRVRVRV RV 100.00
N0
27
100 0.00 10.0 45.0 100 0.00 9.52 38.1
100 0.00 5.00 37.5 100 0.00 10.0 30.0 RV RV RV RV RV RV RV RV 100 0.00 10.0 45.0 100 0.00 6.67 20.0 RV RV RV RV
45.0 90 52.4 90.5
94.4% 94.0% 94.3%
57.5 95 95.16 60.0 90 90.63 RV RV 91.18 RV RV 100.00 45.0 90 95.46 73.3 93.3 88.16 RV RV 90.63 RV RVRVRVRV RV 100.00
94.8% 94.3%
100 0.00 8.70 39.1 100 0.00 0.00 35.3
100 2.50 7.50 45.0 100 5.00 15.0 50.0
52.2 91.3 64.7 100
45.0 90 97.58
17,060 474,995
100% 100% 100% 100% 100% 100%
30.0 80 93.75 RV RVRVRVRV RV 91.18
--
2
2 4.00% 0 00.0% 0 0.00% 0 0.00% 0 0.00%
0.0% 0.6% 0.9% 0.0% 4.1% 0.6% 0.0% 2.3% 0.7%
Caucasian
Economically Disadvantaged Students with Disabilities Limited English Proficient Female
Male
5th Grade Literacy Combined Population TAGG
African American
Hispanic
Caucasian
Economically Disadvantaged Students with Disabilities Limited English Proficient Female
Male
5th Grade Mathematics Combined Population TAGG
African American
Hispanic
Caucasian
Economically Disadvantaged Students with Disabilities Limited English Proficient Female
Male
5th Grade Science Combined Population TAGG
African American
Caucasian
Economically Disadvantaged Students with Disabilities Female
100 2.70 8.11 16.2 100 5.56 2.22 38.9 RV RV RV RV RV RV RV RV 100 2.44 14.6 19.5 100 4.65 9.30 16.3
100 0.00 9.09 15.9 100 0.00 21.7 26.1 100 0.00 13.5 24.3
RV RV RV RV 100 0.00 9.68 9.68 100 0.00 20.0 13.3 100 0.00 40.0 50.0
RV RV RV RV 100 0.00 4.55 11.4 100 0.00 13.6 20.5
100 6.74 3.37 41.6 100 20.8 8.33 41.7 100 10.8 5.41 59.5
RV RV RV RV 100 6.45 0.00 38.7 100 20.0 6.67 40.0 100 50.0 10.0 20.0 RV RV RV RV 100 6.67 2.22 40.0 100 6.82 4.55 43.2
100 3.37 20.2 49.4 100 8.33 29.2 50.0 100 8.11 32.4 54.1 100 0.00 12.9 48.4 100 13.3 26.7 46.7 100 20.0 40.0 30.0 100 2.22 22.2 51.1
RV RV RV RV 100 5.00 10.0 40.0 100 0.00 13.3 46.7
RV RV 100.00 45.0 85 100.00 40.0 86.7 92.10
212
62 4.88% 23 2.89% 7 1.85% 4 1.41% 1 2.17%
2,439
1,514 4.64% 572 2.63% 279 2.30% 137 1.80% 82 1.05%
RV RVRVRVRV RV 81.25
RV RV 100 4.35 100 0.00
100 0.00 RV RV RV RV RV RV RV RV RV RV RV RV RV RV
100 9.09 RV RV RV RV RV RV RV RV RV RV RV RV
RV 8.70 5.88
0.00 RV RV RV RV RV RV RV
9.09 RV RV RV RV RV RV
RV RV RV 100.00 43.5 43.5 87
47.1 47.1 94.2
63.6 36.4 100 95.16 RV RV RV 90.63 RV RV RV 91.18 RV RV RV 100.00 RV RV RV 95.46 RV RV RV 88.16 RV RV RV 100.00 RV RV RV 100.00
81.8 0.00 81.8 97.58 RV RV RV 93.75 RV RV RV 91.18 RV RV RV 100.00 RV RV RV 100.00 RV RV RV 92.10 RV RV RV 100.00
4.88%
23 572
100 0.00 367.4
54.5 9.09 63.59
%% Percent of Students School Choice
41.0% 1.0% 1.0%
Number Meeting Eligible Growth Math Math
51 50.98 25 44 12 41.67
Number Meeting Eligible Growth Literacy Literacy
44 88.64 22 86.36 10 90
0.6% 0.9% 4.1% 0.6% 2.3% 0.7%
Prof &
Needs Improvement Priority NeedsImprovementPriorityMetYear1 ExitCriteria Needs Improvement Focus
Needs Improvement Focus Met Year 1 Exit Criteria Achieving
Exemplary
School Rating
School Rating
Overall Points for School Rating
Annual Accreditation Status
Annual Accreditation Status Accredited Accredited-Cited
Accredited-Probationary
Attendance Rate (*State Goal 91.13%)
Attendance Rate Combined
Attendance Rate for Targated Achievement Gap Group Attendance Rate African American
Attendance Rate Hispanic
Attendance Rate Caucasian
Attendance Rate Economically Disadvantaged Attendance Rate Students with Disabilities
Attendance Rate Limited English Proficient
Dropout Rate
Enrollment
October 1 Enrollment
School Environment
Discipline Policies Distibuted to Parents
Discipline Training Provided to Staff
Parental Involvement Plan Adopted
District Alternative Learning Environment Compliance Expulsions
Weapons Incidents
Staff Assaults
Student Assaults
Retention
Number of Students Retained at Grade 1
Percent of Students Retained atGrade1
Number of Students Retained at Grade 2
Percent of Students Retained atGrade2
Number of Students Retained at Grade 3
Percent of Students Retained atGrade3
Number of Students Retained at Grade 4
Percent of Students Retained atGrade4 NumberofStudentsRetainedatGrade 5
Percent of Students Retained atGrade5
Teacher Quality
%Teachers Completely Certified (Licensed) %TeacherswithEmergency/Provisional Credentials %Teachers with Bachelor's Degree
%Teachers with Master's Degree
%Teachers with Advanced Degree
HQ Teachers in High Poverty Schools
%Core Academic Classes not Taught by HQTeachers HQ Teachers in Low Poverty Schools
%Core Academic Classes not Taught by HQTeachers HQTeachers Aggregate of All Economic Levels %Core Academic Classes not Taught by HQTeachers School Choice
Free and Reduced Meals
PercentofStudentsEligibleforFreeandReducedMeals
876 36 1 81 4
92.2 81.3 78.2
RV 100 75 RV RV 94.5 89.3
93.8 81.3 82.6
RV 100.03 83.3 RV RV 94.5 92.8
97.6 90.9 90.9
RV 100 94.4 RV RV 100 95.3
84.6 68.2 63.6
RV 73.0 89.2 33.3 72.2 RV RV RV RV 63.4 82.9 69.8 86.1
75.0 90.9 52.2 78.3 62.2 86.5
RV RV 80.6 90.28 66.7 80 10.0 60
RV RV 84.1 95.5 65.9 86.4
48.3 89.9 29.2 70.9 24.3 83.8
RV RV 54.8 93.5 33.3 73./3 20.0 40 RV RV 51.1 91.1 45.5 88.7
27.0 76.4 12.5 62.5 5.41 59.51 38.7 87.1 13.3 60 10.0 40 24.4 75.5
97.2 7.29
97.7 10.5
97.7 8.94 33.,6
97.6 25.7
98.2 36.2
97.5 36.2
98.5 25.0
97.4 15.0 16 .7
50 55 45 55 52 58 50 58 46 50 49 54 49 52 57 61 47 47 51 54 55 60 38 46 45 54 41 49 44 53 47 60 47 52 46 53 42 51 37 47
7,110 -- 36 0 0
553 25,004 592 18,262 21.19 22.46
19.84 21.38 19.61 21.02 20.73 21.90 19.98 21.24
30 84 510 599 509 597 494 584
775 25,547 1,675 44,424 436 14,143 -- 460
42.7% 51.5% 38.4% 46.2% 0.0% 33.2% 38.9% 50.6%
77.3% 79.7% 71.6% 69.9% 72.0% 79.0% 83.2% 82.4%
28 876 3 36 0 1 3 81
98.1 35.2 99.3 75.6 100 32.0 97.5 22.4 97.6 28.6
27.2 11.1 28.0 20.6 22.0
97.6 10.8
96.9 15.1
97.4 15.0 29.l2
91.4 12.2 98.6 6.16 96.7 14.6 98.7 32.1 96.8 16.7 97.7 8.25 97.4 13.3
95.5 10.4 93.3 14.9 94.2 15.6 96.5 9.09 96.8 5.00 93.7 14.8 81.9 22.1 100 17.6 97.5 7.84 93.7 12.9
28.4 17.3 28.8 38.5 26.7 20.7 26.3
25.9 33.6 35.1 25.5 15.8 32.9 39.3 23.5 25.2 26.7
Number of Students Taking Voluntary Universal ACT
District Provided Remediation for Students Taking Voluntary Universal ACT Number of Students in College and Career Readiness Planning (CCRPP) Number of Students Taking ACT in Grades 9-11 NumberofStudentsTakingACT inGrade12
ACT Reading
ACT English
ACT Mathematics
ACT Science
ACT Composite
Scholastic Assessment Test (SAT)
Number of Students Taking SAT College Admission Test
SAT Critical Reading Mean
SAT Math Mean
SAT Writing Mean
Advanced Placement Courses (AP)
Number of Students Taking Advanced Placement (AP) Courses NumberofAPExamsTaken
Number of AP Exams Scored 3, 4, or 5
NumberofStudents TakingInternationalBaccalaureateCourses College Going Rate
AllStudents
AfricanAmerican
Hispanic
Caucasian
College Credit Accumulation Rate
AllStudents
AfricanAmerican
Hispanic
Caucasian
Arkansas ESEA Accountability
Needs Improvement
Needs Improvement Priority
NeedsImprovementPriorityMetYear1 ExitCriteria NeedsImprovementFocus
Needs Improvement Focus Met Year 1 Exitr Criteria
School
District 40.7 $11,115 $51,946 $210,513,920 $99,500,321 $13,845,614 $3,520,238 $12,693,016 $10,268,099
94.0 25.1
93.3 34.4
93.1 36.2
94.2 30.6
94.9 11.1
94.0 34.4
89.1 35.9
100 47.1
93.3 22.2
94.7 27.7 398.3
95.7 6.01 26 .7
26.0 33.0
21.3 26.2 26.0 26.6
7 279 1.85% 2.30% 4 137 1.41% 1.80% 1 82 2.17% 1.05% 35 134 4.45% 1.38% 36 315 2.90% 1.79% 21 274 1.71% 1.43%
23.5 28.9
40.4 40.4 41.2 34.7 40.3 41.2 23.7 29.4 41.8
55.6%
14.6
62.5
95.2% 94.6% 95.4% 95.9% 95.0% 94.4% 94.9% 95.9% --
258
Y Y Y
93.8%
93.5%
94.0%
93.9%
93.4%
93.3% 93.8%
93.7% 94.2% 3.43%
94.1% 95.3% 2.10%
95.9% 95.0% 94.9% 95.5% 95.5% 94.0% 96.0% 96.4% --
463
Y Y Y
-- -- -- --
2 2.56% 0 0.00% 0 0.00% 0 0.00% 0 0.00%
100.0% 0.0% 48.0% 48.0% 0.0%
0.9% 0.0% 0.0%
93.8% 94.4% 93.5% 94.0% 94.0% 94.3% 93.9% 94.8% 93.4% 94.3% 93.3% 93.8% 93.7% 94.1% 94.2% 95.3% 3.43% 2.10%
17,060 474,995
100% 100% 100% 100% 100% 100%
Y 91.05% 30 524 71 843 59 504
212 2.439 62 1,514
Y 91.05% 30 524 1 71 843 1 59 504
98.9%
1.6%
53.0% 44.0%
0.0% 1.0% 1.0%
2.63%
100% 4.2% 83.0% 17.0%
95.7% 0.8% 57.0% 41.0%
1.85%
4 137
2.17%
0.00% 0.13%
36.4% 55.6% 60.9%
2.82%
4th Grade Literacy
All Students
African American
Hispanic
Caucasian
Economically Disadvantaged Students with Disabilities Limited English Proficient 4rd Grade Mathematics
All Students
African American
Hispanic
Caucasian
Economically Disadvantaged Students with Disabilities Limited English Proficient 8th Grade Literacy
All Students
African American
Hispanic
Caucasian
Economically Disadvantaged Students with Disabilities Limited English Proficient 8th Grade Mathematics
All Students
African American
Hispanic
Caucasian
Economically Disadvantaged Students with Disabilities Limited English Proficient
Grade One Reading Comprehension Grade One Math Problems
Grade Two Reading Comprehension Grade Two Math Problems
Grade Three Reading
Grade Three Math
Grade Four Reading
Grade Four Math
Grade Five Reading
Grade Five Math
Grade Five Science
Grade Six Reading
Grade Six Math
Grade Seven Reading
Grade Seven Math
Grade Seven Science
Grade Eight Reading
Grade Eight Math
Grade Nine Reading Comprehension Grade Nine Math Concepts and Problems American College Test
34 34 55 30 43 33 26 36 44 34 72 19 53 31
17 44 36 47 21 48 11 42 23 49 44 37 24 49
27 43 47 41 31 48 20 42 36 44 70 23 45 43
31 41
59 32 9 0
Math Math Literacy
42 46
11 1
School District State
23 5
17,060 474,995
100% 100% 100% 100% 100% 100%
18 2 28 6 15 2
20 0.2% American Indian 6 21.6% Asian
Number Eligible Math
Meeting Number Growth Eligible Math Literacy
Meeting Growth Literacy
6% 21%
Prof &
AMO
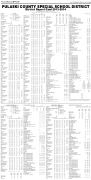
v v THURSDAY, APRIL 30, 2015 v 1G
PULASKI COUNTY SPECIAL SCHOOL DISTRICT District Report Card 2013-2014
Characteristics
Enrollment 17,060 Avg. Class Size 17 Avg.yearsteaching Experience 7 Perpupilspending
• District avg. $11,115 • State avg. $9,457 SchoolChoiceTransfers 23
Other Demographics
Limited English proficiency 3% Lowincome 56% Studenteligibletoreceivespecialeducation 12%
Demographics
Race/Ethnicity Statistics
0.5% American Indian
2.0% Asian
43.5% Black/AfricanAmerican 0.1% Hawaiian/Pacific Islander 6.6% Hispanic/Latino
44.4% White
Below %Tested Basic Basic
Prof & Proficient Advanced Advanced AMO
%
Meeting Number Growth Eligible
% Meeting Growth Literacy
70.52 62.49 62.96 71.88 77.31 63.48 32.39 60.37
School
District 1
0
2 4 14 12 3
Y
31 4 0
93.8% 93.5% 94.0% 93.3% 93.4% 93.3% 93.7% 94.2% 3.43%
State 67 1
162 322 365 158 43
100%
790 254 27
94.4% 94.0% 94.3% 94.8% 94.3% 93.8% 94.1% 95.3% 2.10%
Caucasian
Economically Disadvantaged Students with Disabilities Limited English Proficient Female
Male
7th Grade Literacy Combined Population TAGG
African American
Hispanic
Caucasian
Economically Disadvantaged Students with Disabilities Limited English Proficient Female
Male
7th Grade Mathematics Combined Population TAGG
African American
Hispanic
Caucasian
Economically Disadvantaged Students with Disabilities Limited English Proficient Female
Male
7th Grade Science Combined Population TAGG
African American
Hispanic
Caucasian
Economically Disadvantaged Students with Disabilities Limited English Proficient Female
Male
8th Grade Literacy Combined Population TAGG
African American
Hispanic
Caucasian
Economically Disadvantaged Students with Disabilities Limited English Proficient Female
Male
8th Grade Mathematics Combined Population TAGG
African American
Hispanic
Caucasian
Economically Disadvantaged Students with Disabilities Limited English Proficient Female
Male
EOC Algebra I
Combined Population TAGG
African American
Hispanic
Caucasian
Economically Disadvantaged Students with Disabilities Limited English Proficient Female
Male
EOC Geometry
Combined Population TAGG
African American
Hispanic
Caucasian
Economically Disadvantaged Students with Disabilities Limited English Proficient Female
Male
EOC Biology
Combined Population TAGG
African American
Hispanic
Caucasian
Economically Disadvantaged Students with Disabilities Limited English Proficient Female
Male
Grade 11 Literacy Combined Population TAGG
African American
97.4 8.27 99.4 22.2 98.6 63.0 100 22.6 98.4 12.1 97.1 20.9
16.3 27.2 25.3 29.0 21.1 23.0
30.6 29.9 9.59 25.8 34.2 26.1
41.0 40.0 38.5 47.3 42.9 41.6 12.4 40.6 41.6 40.5
31.4 27.6 30.7 36.0 31.8 28.8 8.28 18.2 33.2 29.8
15.8 8.10 7.85 12.0 25.2 8.20 2.76 0.00 16.5 15.2
46.6 46.2 45.6 67.7 46.6 46.7 16.3 73.9 50.2 43.6
34.0 27.1 26.9 37.5 40.9 27.1 10.4 32.0
36.3 31.8
44.2 42.1 42.9 44.6 45.7 43.1 20.5 43.3 46.1 42.3
45.8 40.4 39.4 54.5 52.1 41.5 23.0 58.8 47.8 43.8
25.4 18.1 16.9 20.4 35.4 19.0 13.7 23.5 28.1 23.0
50.6 47.1 49.8 59.6 50.6 50.8 4.95 35.7 53.5 47.9
44.8 75.4 85.20 20.7 50.6 71.56 2.05 11.64 50.89 22.6 48.4 71.82 32.5 66.7
30.0 56.1
25.8 66.8 76.47 16.5 56.5 69.32 19.0 57.5 69.27 21.6 68.9 77.34 34.0 76.9 82.71 17.3 58.9 70.50 2.07 14.47 44.21 6.25 46.85 68.00 35.3 76.9
16.2 56.7
21.8 53.1 77.13 14.1 41.8 70.73 12.2 42.9 68.22 18.7 54.7 79.18 32.4 64.2 85.20 14.6 43.4 71.56 3.45 11.73 50.89 6.06 24.26 71.82 24.6 57.8
18.7 48.5
1.78 17.58 1.10 9.2 0.73 8.58 0.00 12 3.30 28.5 0.88 9.08 1.38 4.14 0.00 0 1.24 17.74 2.32 17.52
23.9 70.5 76.47 13.9 60.1 69.32 16.8 62.4 69.27 11.3 79 77.34 31.4 78 82.71 14.6 61.3 70.50 0.74 17.04 44.21 0.00 73.9 68.00 32.7 82.9
16.3 59.9
19.1 53.1 77.13 10.5 37.6 70.73 10.9 37.8 68.22 10.9 48.4 79.18 27.5 68.4 85.20 10.5 37.6 71.56 2.96 13.36 50.89 8.00 40 71.82 20.7 57
17.6 49.4
21.6 65.8 77.13 14.0 56.1 70.73 13.0 55.9 68.22 14.9 59.5 79.18 30.8 76.5 85.20 13.5 56.6 71.56 8.97 29.47 50.89 13.3 56.6 71.82 24.9 71
18.1 60.4
17.8 63.6 77.13 11.1 51.5 70.73 9.94 49.34 68.22 10.9 65.4 79.18 27.1 79.2 85.20 10.8 52.3 71.56 15.6 38.6 50.89 0.00 58.8 71.82 19.2 67
16.5 60.3
9.,12 34.52 7.19 25.29 5.69 22.59 14.3 34.7 13.3 48.7 5.38 24.38 26.7 40.4 0.00 23.5 8.02 36.12 10.1 33.1
16.7 67.3 76.47 9.61 56.71 69.32 8.94 58.74 69.27 6.38 65.98 77.34 26.5 77.1 82.71 9.25 60.05 70.59 11.9 16.85 44.21 0.00 35.7 68.00 18.8 72.3
Number Eligible
Achieving
Exemplary
School Rating
School Rating
Overall Points for School Rating
Count of Schools with Rating = A (270 - 300 Points)
Count of Schools with Rating = B (240 - 269 Points)
Count of Schools with Rating = C (210 - 239 Points)
Count of Schools with Rating = D (180 - 209 Points)
Count of Schools with Rating = F (Less than 180 Points) District Provides Textbooks or Digital Resources for all Pupils District Provides Textbooks or Digital Resources for all Pupils Annual Accreditation Status
Annual Accreditation Status Accredited Accredited-Cited Accredited-Probationary
Attendance Rate (*State Goal 91.13%) Attendance Rate Combined
Attendance Rate for Targated Achievement Gap Group Attendance Rate African American
Attendance Rate Hispanic
Attendance Rate Caucasian
Attendance Rate Economically Disadvantaged Attendance Rate Students with Disabilities Attendance Rate Limited English Proficient Dropout Rate
Graduation Rate (*State Goal 85%)
Published annually as required under ARK. Code Ann. 6-15-2006B
925 E. Dixon Rd • Little Rock, AR 72206 • 501-234-2000 • Superintendent Jerry Guess
72.7% 66.6% 72.1% 72.0% 72.8% 66.2% 69.4% 90.0% 5.6% 59.8%
86.9% 82.9% 81.0% 84.5% 89.3% 82.7% 83.1% 84.1% 7% 45.4%
2.89%
7 279
1.41%
1 82
98.9%
1.6% 0.8%
53.0% 44.0%
57.0%
91.05%
81.82 88.24 75 100
State 55 55 58 58 50 54 52 61 47 54 60
Avg. Class Size Avg.yearsteaching Experience Per pupil spending
• District avg.
•Stateavg. SchoolChoiceTransfers
Other Demographics
Limited English proficiency
Lowincome
Student eligible to receive special education 5%
4.64%
2.30%
1.80% 1.05% 95.7%